")
")
")
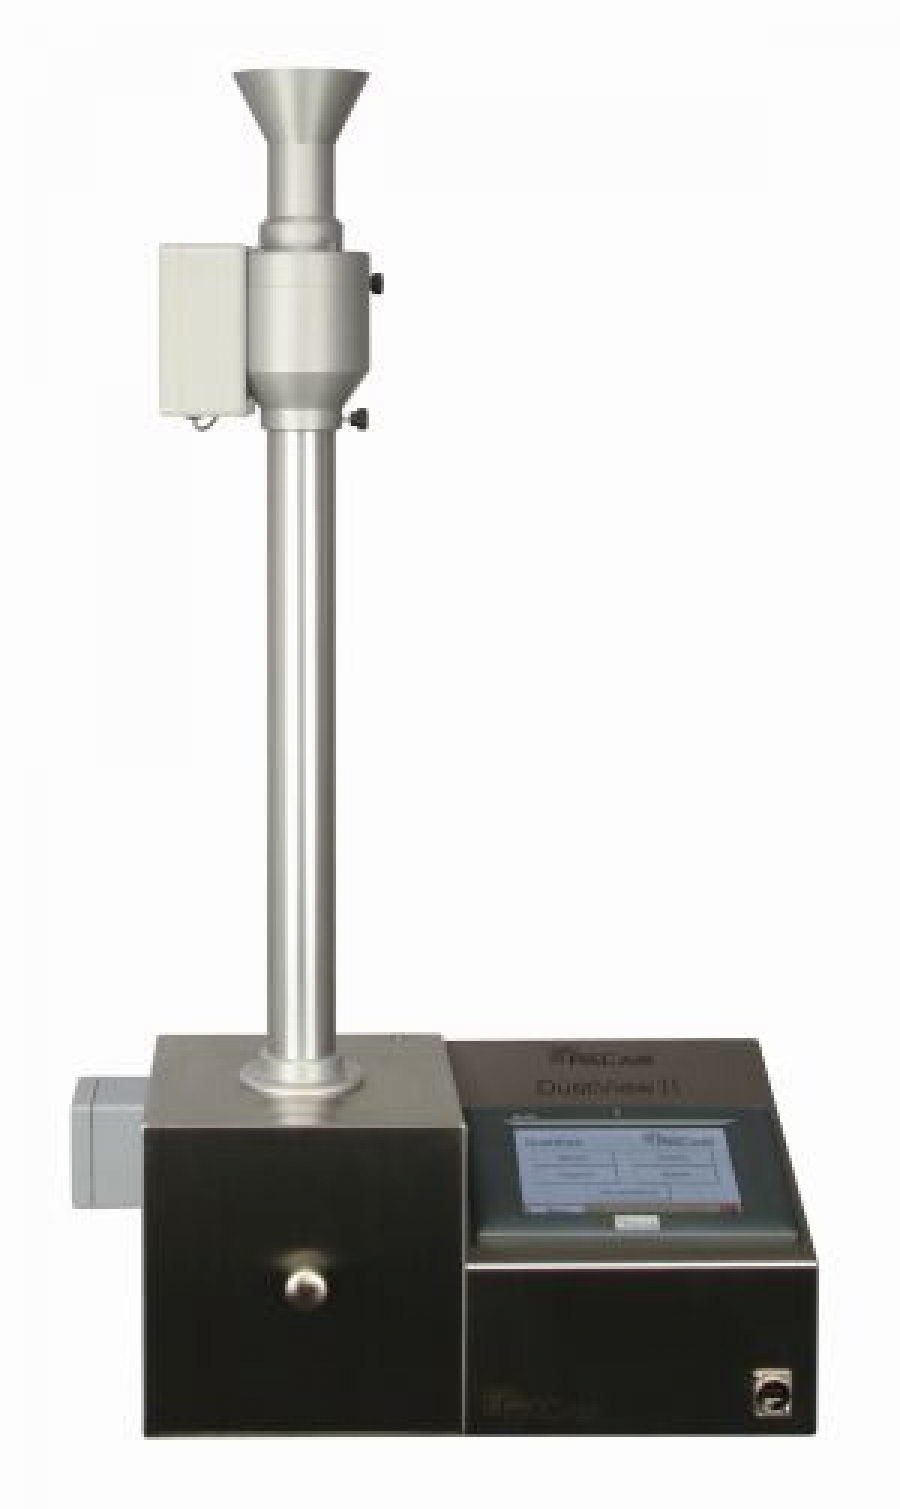
Dust measuring device for comparison of dust generation of powders and bulk materials
During the production, conveying or filling of powders, bulk materials, granulates, etc., dust can occur. In order to minimize this dust generation, the powders can be optimized by the manufacturer. The comparison of dust generation, i.e. the dust behaviour of different powders or the effect of the above-mentioned optimization, can be carried out almost fully automatically and economically by determining the dust content with the DustView II.
Dusting behaviour
Dusting behaviour is the property of materials (substances, mixtures and articles) to develop and release airborne dusts during a certain type of activity.
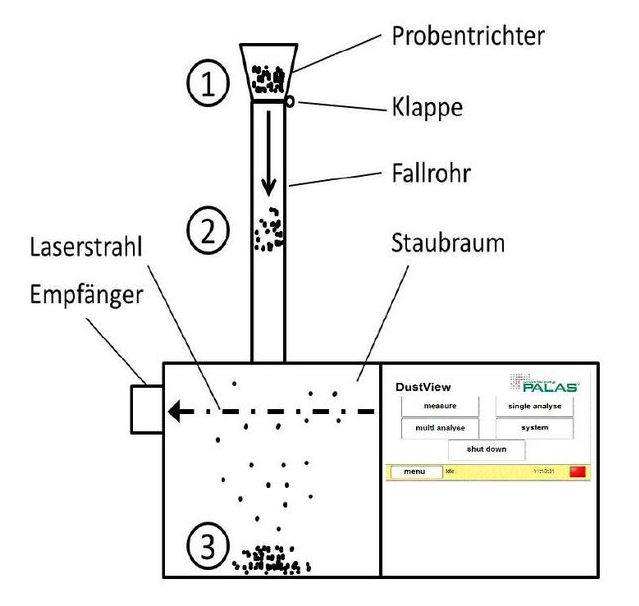
- Loading the sample (typically 30 g bulk material) into the hopper.
- Start of measurement: The flap opens automatically and the sample falls into the dust chamber.
- The measurement is started immediately after opening the flap.
- The dust whirls up in the chamber. The dust generation causes an attenuation of the laser beam (extinction measurement). During the measurement, this attenuation is observed and recorded as a dust value between 0 and 100. 0 = no shading of the laser beam by the dust development, i.e. only marginal dust components are present in the chamber. 100 = complete shading of the laser beam by the dust turbulence.
- The dust values are a variable in time and indicate the light attenuation in relation to the 0 value ( = no attenuation). The 0 value is determined automatically before each measurement without dust (calibration!).
- End of the measurement and automatic storage of the data.
- Determination of the dust number as comparison value for the dust behaviour.
- The dust number (STZ) consists of the maximum dust value that has occurred and the dust value that occurs 30 seconds after reaching the maximum value:
- Number of dusts (STZ) = Max. value + 30 sec. value
Measurement results (example)
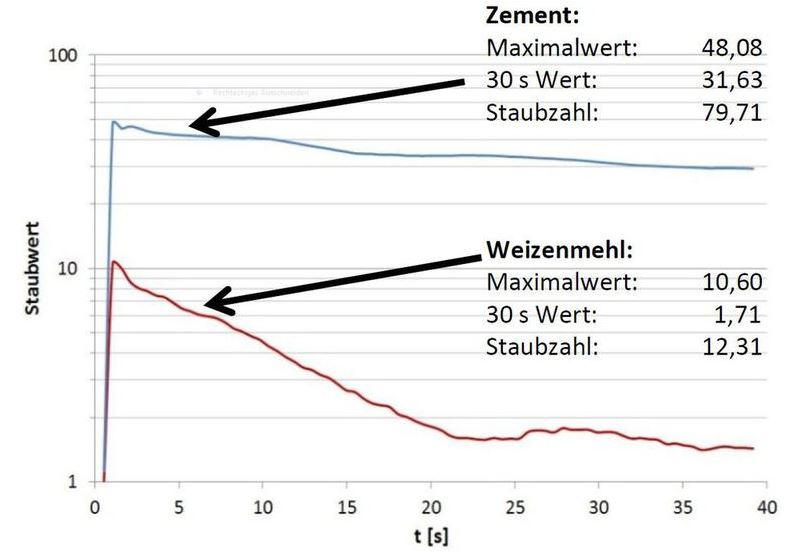 Fig. 3: Graphical comparison of two bulk solids
Due to the finer grain size distribution and the material properties, the cement sample whirls up considerably more dust than the wheat flour sample. The wheat flour contains significantly larger particles, which quickly fall to the bottom of the chamber during the measurement, while the finer cement particles remain almost completely suspended even after 30 seconds.
With these comparative measurements, product optimisation with regard to dust behaviour can be easily verified.
The high reproducibility of the measurement enables simple and economical production control of bulk materials.
Firmware and Software
After a measurement has been completed, the result is displayed directly on the device. The results are available graphically as numerical values on the one hand and as a temporal course of the dust values on the other. The automatic storage of the results allows the analysis of older measurements without an additional PC.
It is possible to create reports as PDF or text files. In addition, a report can be printed directly via a printer.
The firmware of the DustView II allows not only the analysis of individual measurements but also the comparison of up to ten different measurements with each other. The mentioned report options are also available.
The serial measurement option can also be used to create averages over several measurements in a simple and time-saving manner.
The scope of delivery also includes evaluation software for analyzing measurements on an external PC.
Special advantages
- High information content regarding the dust behaviour of bulk materials
- DustView II based on CIPAC MT 171
- Fully automatic, reproducible measuring sequence
- Fully automatic control and evaluation via Panel PC, no external PC required for evaluation
- Simple and intuitive operation via touchscreen
- Fast measuring sequence (40 s)
- Compact, portable device
- Comparison of several measurements with each other
- Single measurements / serial measurements
- Create reports as PDF, text files or printouts
- Reliable function
- Self-calibrating via automatic offset adjustment
- Automatic internal service display
- networkable
- Low maintenance
- Reduces your operating costs
- quality control
- product development
- process optimisation
- production losses
- occupational safety
- industrial hygiene
- Measurement of environmental impact
- Prevention of dust explosions